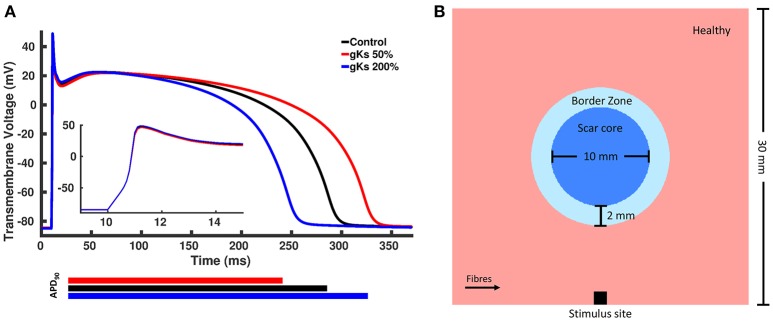
Figure 2.
(A) Action potentials of the control and two modified models. The blue line represents the model with shorter action potential duration (APD) obtained by increasing the conductance of the slow rectifying potassium current, gKs, to 200% of the control value, whereas the red line represents the model with longer APD obtained by decreasing gKs to 50% of the control value and the black line represented the control model with unchanged parameters. (B) Rectangular tissue model with a circumferential scar. The whole tissue measures 30 mm × 30 mm, where the scar core measures 10 mm in diameter and is surrounded by a 2 mm thick BZ. Healthy myocardium is represented in pink, scar core in dark blue and BZ in light blue. Fibers in healthy myocardium are always aligned with the x axis, whereas at the BZ, fibers are either aligned with the x axis or randomly oriented. Stimuli are delivered at the center of the bottom tissue edge.

