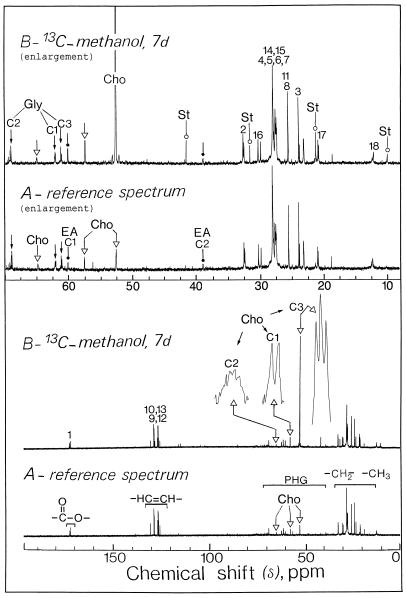
Figure 5.
Representative in vitro 13C-NMR spectra of a lipid extract from sycamore cells. The spectra, recorded at 20°C, are the results of 900 transients (90 min). Lipid extracts were prepared from a standard exponentially growing suspension culture (9 g wet weight) according to the procedure described in “Materials and Methods.” A, Control cells at pH 6.0; B, cells incubated for 7 d with 5 mm [13C]methanol at pH 6.0. Part of the lipid methylene groups are shown on expanded scales (magnification, ×8). Note the massive label in the methyl carbons of choline associated with phosphatidylcholine. Peak assignments are as follows: Gly, C1, C2, C3, carbons of the sn glycerol backbone (small arrow); Cho, C1, C2, C3, carbons of choline (▵); EA, C1, C2, carbons of ethanolamine (dot); St, 24-methyl, and 24-ethyl sterols such as camposterol and sitosterol (○); 1 to 18, carbon atoms of esterified fatty acids; COO−, carbonyl carbon of esterified fatty acids; –CH=CH–, olephinic carbons belonging to mono- or polyunsaturated esterified fatty acids; PHG, carbons associated with the polar head groups of lipids; –CH2–, –CH3–, methylene and methyl carbons of esterified fatty acids.

