
Figure 3.
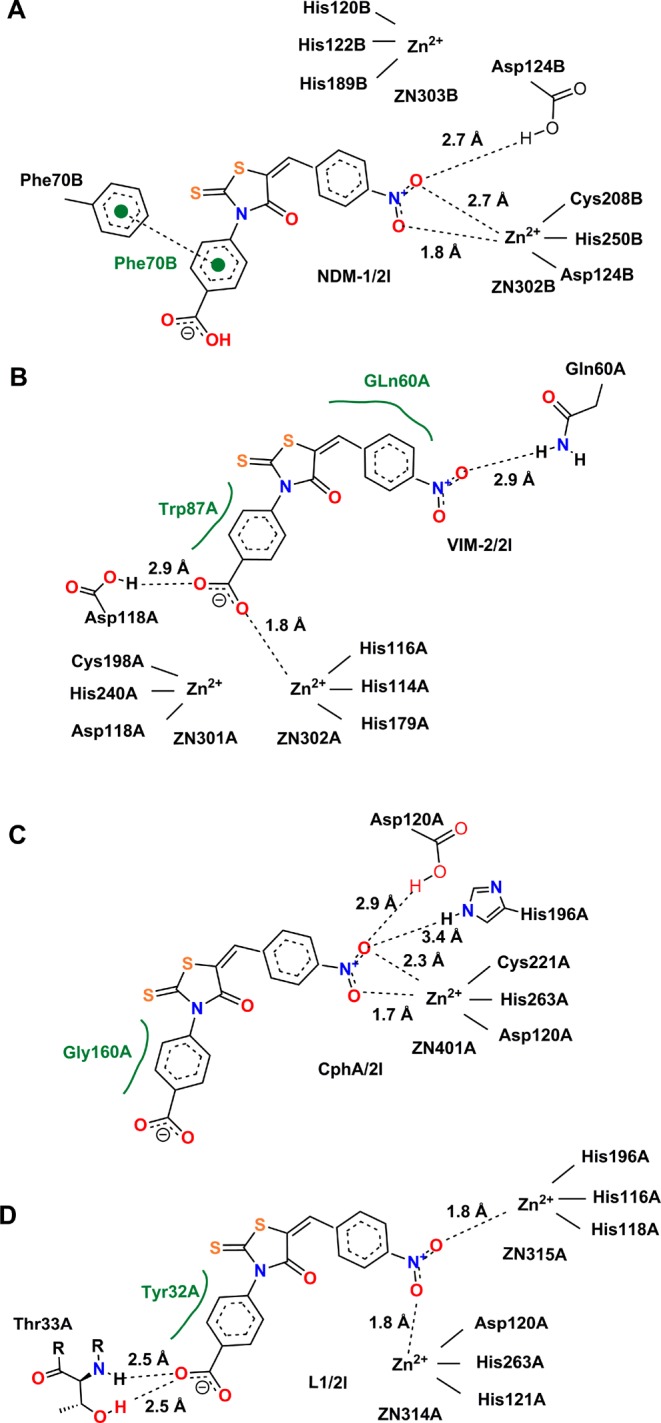
Lowest-energy conformations of 2l docked into the active sites of different enzymes. Graphs A–D show key electrostatic interactions of 2l with Zn(II) ions and residues of the MβLs NDM-1, VIM-2, CphA (as a proxy of ImiS), and L1, respectively, indicated by dashed lines, while hydrophobic interactions are shown in green. The capital letters A and B following the amino acid residue numbers show the protein chains A and B in the crystal structure. All 2D images were generated with PoseView (www.biosolveit.de/PoseView/) and redrawn with ChemBioDraw 14.0.