Figure 1.
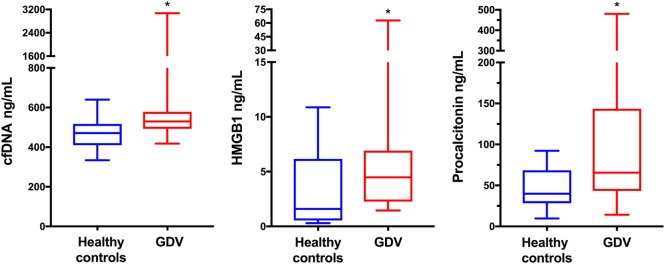
Box and whisker plot comparisons of plasma concentrations of cell-free DNA (cfDNA), high-mobility group box-1 (HMGB1), and procalcitonin (PCT) from 24 healthy control dogs and 29 dogs with gastric dilatation–volvulus (GDV) syndrome. The central line represents the median, the boxes represent the interquartile range and the whiskers represent the minimum and maximum values. * indicates statistical significance at P < 0.05. Dogs with GDV had significantly greater plasma concentrations of cfDNA, HMGB1 (n = 28) and PCT (n = 28) compared to healthy controls by Mann–Whitney U-test (P = 0.0009, P = 0.004, and P = 0.009, respectively).

