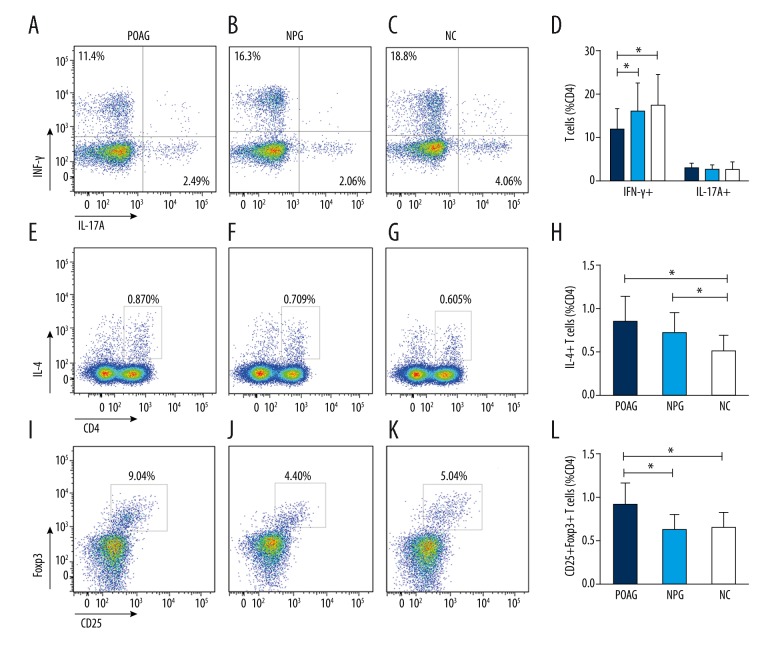
Figure 2.
Comparison of peripheral frequencies of Th1 (CD4+IFN-γ+ T cells), Th2 (CD4+IL-4+ T cells), Th17 (CD4+IL-17A+ T cells), and Treg (CD4+CD25+Foxp3+ T cells) between the primary open-angle glaucoma (POAG) group, the normal-pressure glaucoma (NPG) group, and the normal control (NC) group. (A–D) Representative experiments of the frequencies of Th1 and Th17 cells and comparison between groups. Frequencies of Th1 cells were lower in the POAG and NPG groups compared to the NC group. The difference was significant between the POAG and NC groups (P<0.05). No significant difference in the frequencies of Th17 cells was observed between groups. (E–H) Representative experiments on the frequencies of Th2 cells and comparison between groups. Frequencies of Th2 cells were significantly higher in the POAG and NPG groups compared to the NC group (P<0.05). (I–L) Representative experiments on the frequencies of Treg cells and comparison between groups. The frequency of Treg cells was higher in the POAG group (P<0.05) but not in the NPG group, compared to the NC group. Dark blue column: POAG group; Light blue column: NPG group; whitr column: NC group. Statistical significance was analyzed using the t test. * P<0.05.

