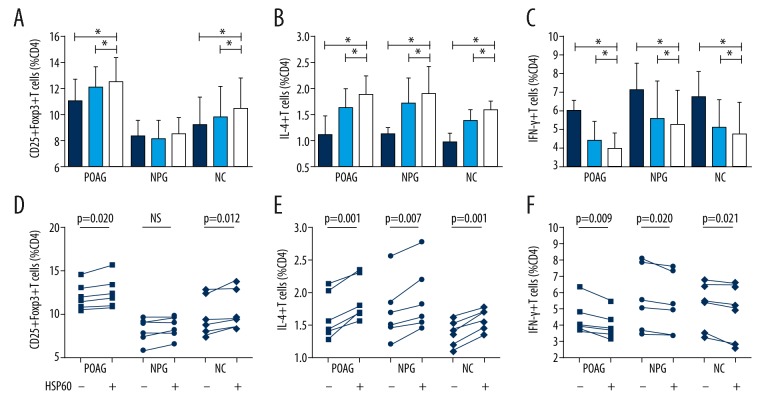
Figure 3.
Frequencies of Th1(CD4+IFN-γ+ T cells), Th2 (CD4+IL-4+ T cells), and Treg (CD4+CD25+Foxp3+ T cells) cultured for 2 days with or without the stimulation of HSP60. (A, D) Frequencies of Treg cells increased more with the stimulation of HSP60 in primary open-angle glaucoma patients and normal subjects. In normal-pressure glaucoma patients, no significant increase of Treg cells was found after 2-day culture with or without HSP60 stimulation. (B, E) Frequencies of Th2 cells increased more significantly with the stimulation of HSP60 in all groups. (C, F) Frequencies of Th1 cells decreased more significantly with the stimulation of HSP60 in all groups. POAG – primary open-angle glaucoma; NPG – normal-pressure glaucoma; NC – normal control. Dark blue column: basic Th cell frequency; light blue column: Th cell frequency on day 2, without HSP60 stimulation; white column: Th cell frequency on day 2, with HSP60 stimulation. Statistical significance was analyzed using a paired t test or signed-rank test (n=6). * P<0.05.

