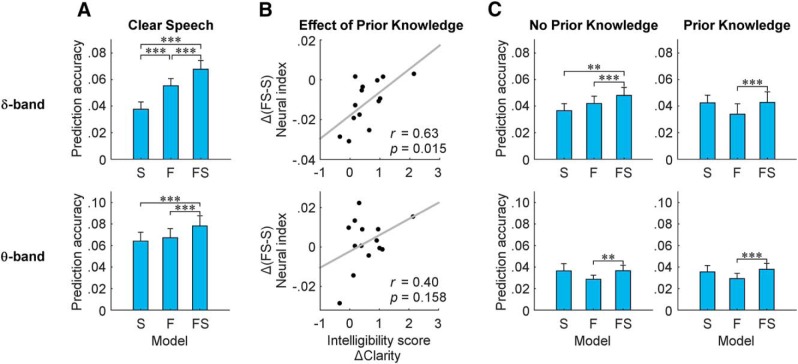
Figure 3.
The effect of P on EEG predictability. Linear regression was used to fit models known as multivariate temporal response functions (mTRFs) between the low-frequency (δ-band: 1–4 Hz and θ-band: 4–8 Hz) EEG and different representations of the speech stimulus. In particular, speech was represented as its spectrogram (S), a time-aligned sequence of categorical phonetic features (F), or a combination of both (FS; *p ≤ 0.05, **p ≤ 0.01, ***p ≤ 0.001). The difference in performance between the FS and S models (i.e., FS–S) is taken as an isolated measure of phoneme-level encoding. A, Correlations (mean ± SEM) between recorded EEG and EEG predicted using the mTRF models for spectrogram (S), phonetic features (F), and their combination (FS) for clear speech. B, A significant positive correlation emerges between the change in perceived intelligibility (measured as Δclarity) and the change in our isolated index of phoneme level δ-band entrainment from NP to P speech segments ((FS–S)P – (FS–S)NP) as a result of P. C, Correlations (mean ± SEM) between recorded EEG and EEG predicted using the mTRF models for spectrogram (S), phonetic features (F), and their combination (FS) for noise-vocoded speech. In the δ-band, the FS model performs best for the NP speech segments (NP) but not for the P segments (P). No significant differences emerge in the θ-band.

