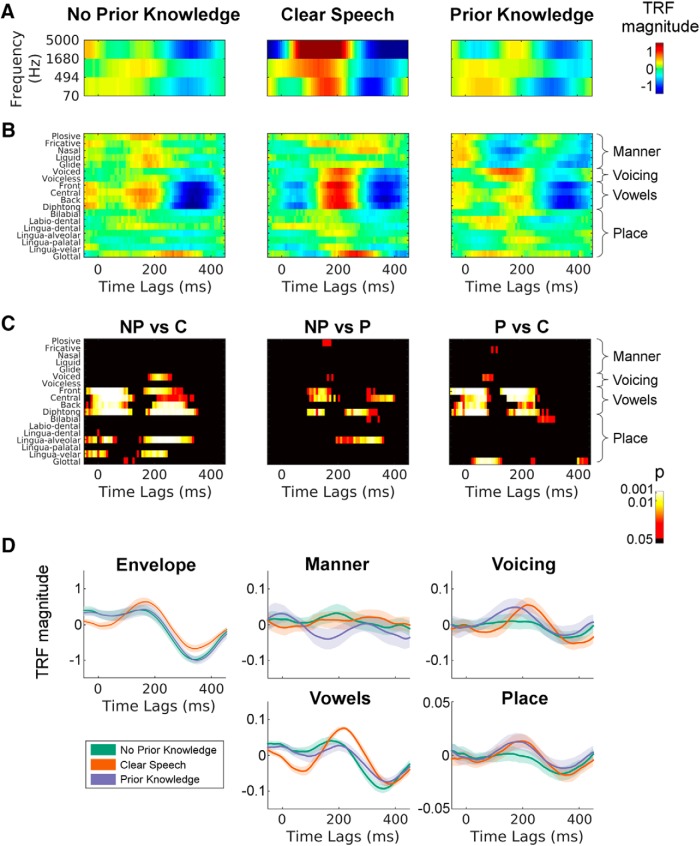
Figure 4.
The effect of P on the TRFs. A, The TRF (model weights) for the spectrogram representation of speech (S) are shown for all conditions after averaging across 12 selected electrodes (see Materials and Methods, EEG data analysis). To allow a direct comparison of all conditions, the TRF for the C model is shown using only three frequency bands, although the model used in the analysis included all 16 bands. Colors indicate the TRF magnitude (arbitrary units). B, TRF models fit using phonetic features (F) are shown for all conditions. C, F model weights were compared between each pair of conditions using t tests at each time lag and phonetic feature. D, To more directly compare the TRF weights between conditions, univariate models are shown for the envelope of speech and for four distinct groups of phonetic features (average weights of each group are reported): manner of articulation, voicing, vowels, and place of articulation.

