
Figure 7.
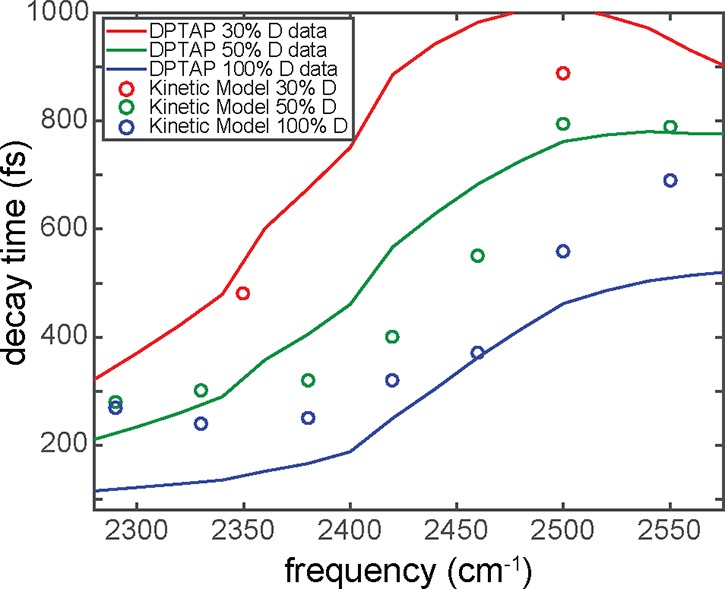
Plot of the τ1 decay versus excitation frequency of DPTAP in different isotopic dilutions of water. The results were modeled (solid lines), with the model depicted in Figure 5, with energy transfer rates given by the concentration of O–D groups. Adapted with permission from ref (81). Copyright 2016 American Chemical Society.