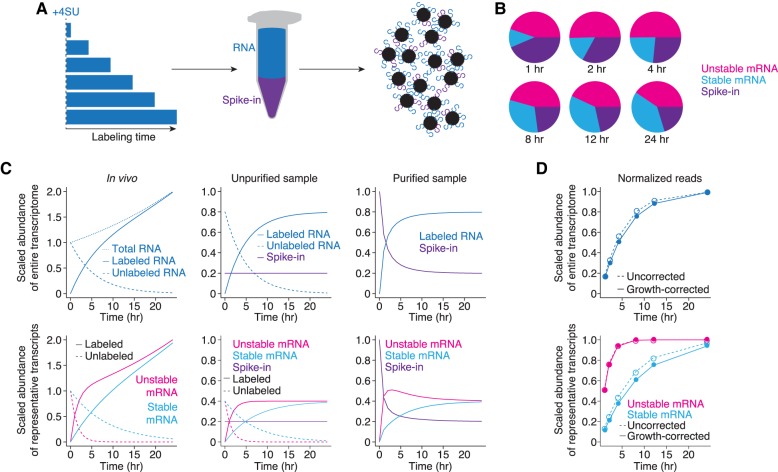
FIGURE 1.
Conceptual underpinnings of the approach-to-equilibrium method. (A) Representation of the approach-to-equilibrium experimental method. Cells are incubated with 4SU for increasing amounts of time. Isolated RNA is then biotinylated in vitro and purified using streptavidin. The eluate is then prepared for high-throughput RNA sequencing. (B) Representation of typical RNA-seq results. Reads for each gene represent a fraction of the total library, which changes through time, depending on individual synthesis and decay rates as well as overall transcription levels. Representative results are shown for an unstable transcript (pink), a stable transcript (blue), and a spike-in (purple). (C) Simulation of abundances during an approach-to-equilibrium experiment for the transcriptome (top) and individual transcripts (bottom), scaled to the total abundance of the transcriptome (top) or the total abundance of an individual transcript (bottom) when labeling starts. (Left) As cells are incubated longer with 4SU, the labeled RNA population increases at a rate sufficient to replace the unlabeled population and for cell growth. The unlabeled population for unstable transcripts (pink) necessarily decreases faster than for stable transcripts (blue). (Center) Once the RNA is extracted, spike-ins are added at a constant ratio to the total amount of RNA, and information about cell growth is lost. (Right) After purification, the ratio of spike-in to labeled sample behaves stereotypically with a rapid decrease over the initial time points and convergence to an asymptote, which represents the ratio of the RNAs in the unpurified sample. Note that at early time points, unstable transcripts represent a larger fraction of the library than their eventual steady-state ratios. (D) Simulation of normalization strategies. The pie charts (from B) are normalized to spike-in levels to calculate the relative abundance of the entire transcriptome or specific transcripts, as appropriate. These measurements can then be growth-corrected, and, using a bounded growth equation, half-lives can be calculated. Note that correcting for growth has a larger effect on stable transcripts than on unstable ones.

