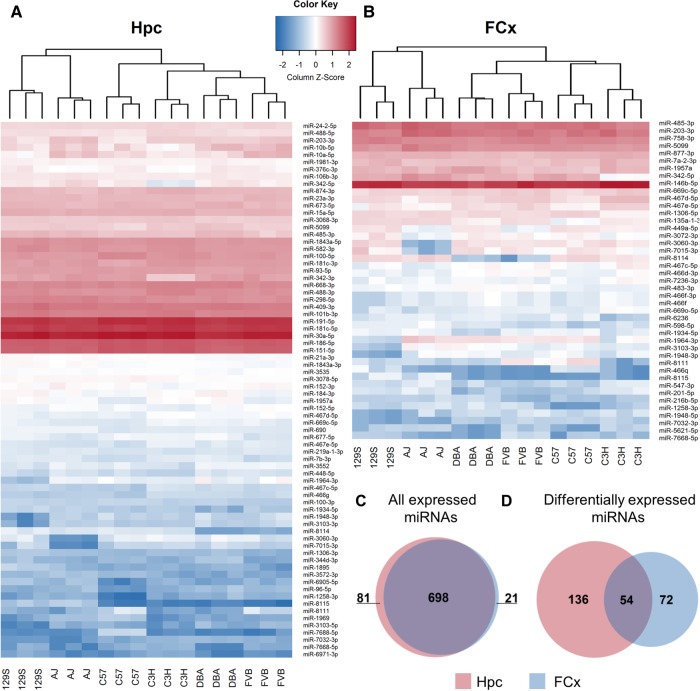
FIGURE 2.
miRNA expression in hippocampus (Hpc) and frontal cortex (FCx) of six inbred mouse strains. Heat map showing the expression levels of the most significantly (adjusted P ≤ 0.001) differentially expressed miRNAs in (A) Hpc (n = 74) and (B) in FCx (n = 43). N = 3 biological replicates per strain and brain region. (C) Overlap of expressed miRNAs in Hpc (n = 779) and in FCx (n = 719). (D) Overlap of differentially expressed miRNAs (adjusted P ≤ 0.05) in Hpc (n = 190) and FCx (n = 126). (DBA) DBA/2J, (AJ) A/J, (129S) 129S1/SvImJ, (C3H) C3H/HeJ, (C57) C57BL/6J, (FVB) FVB/NJ.

