FIGURE 5.
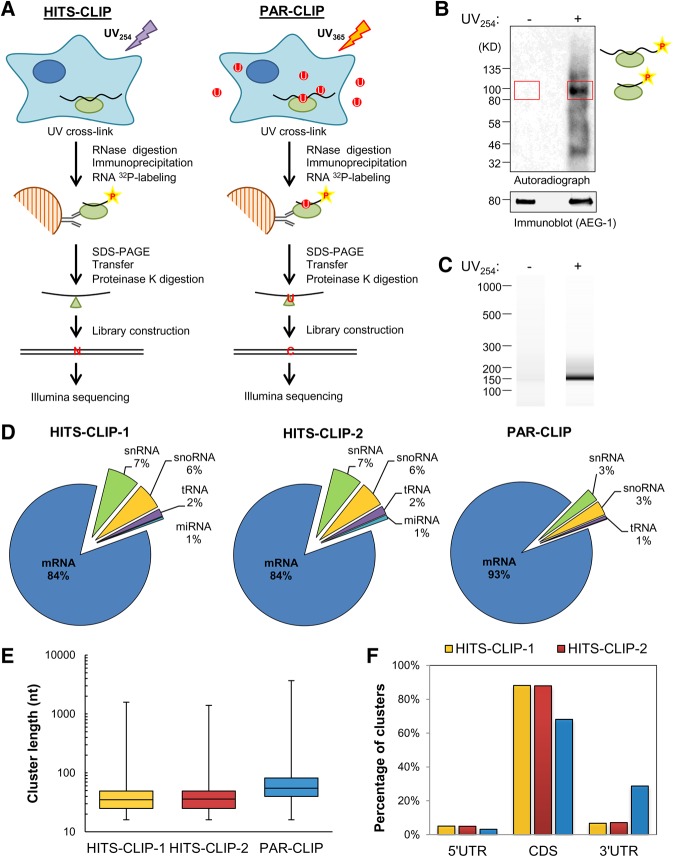
CLIP-based AEG-1 RNA interactome analysis. (A) Schematic of experimental protocols for the identification of AEG-1-binding sites by HITS-CLIP and PAR-CLIP. (B) A representative autoradiogram of radiolabeled AEG-1-RNA complex formation obtained in the HITS-CLIP protocol. The red rectangles indicate the regions (∼85–110 kD) used for proteinase K digestion and RNA fragment purification. (C) A representative Bioanalyzer analysis for HITS-CLIP libraries. The libraries were further purified by PAGE electrophoresis and gel extraction. (D) Distributions of mapped RNA deep sequencing reads for the HITS-CLIP (HITS-CLIP-1 and HITS-CLIP-2) and one PAR-CLIP studies. (E) Cluster length distributions for the CLIP studies. (F) Non-normalized distributions of mapped clusters in the 5′ untranslated region (5′ UTR), coding sequence (CDS), and 3′ untranslated region (3′ UTR).

