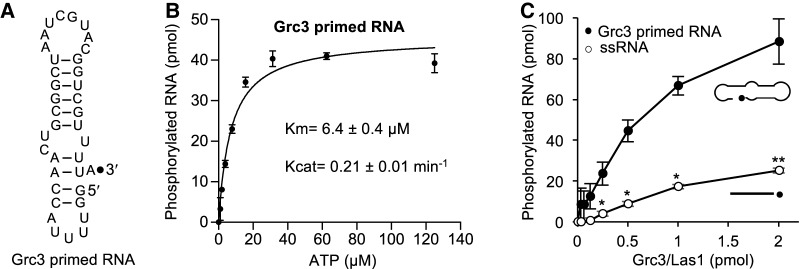
FIGURE 3.
Effects of oligonucleotide substrate on PNK activity. (A) Cartoon diagram of the C2 cleaved pre-rRNA mimic. The black dot marks the 3′-end labeled fluorophore. (B) ATP concentration dependence of Grc3/Las1 phosphotransferase activity toward Grc3 primed RNA. Grc3/Las1 (2 µM) was incubated with 15 µM fluorescently labeled Grc3 primed RNA in the presence of 0–125 µM ATP. The mean was fit using a Michaelis–Menten linear regression and error bars represent the standard deviation from three independent experiments. (C) RNA substrate competition assay. Grc3/Las1 (0–2 µM) was incubated with equimolar single-stranded 21-mer RNA (15 µM) and Grc3 primed RNA (15 µM) in the presence of 1 mM ATP. The mean and standard deviation were calculated from three independent replicates. (*) P < 0.005; (**) P < 2 × 10⁻⁵ were calculated from two-tailed Student's t-tests.

