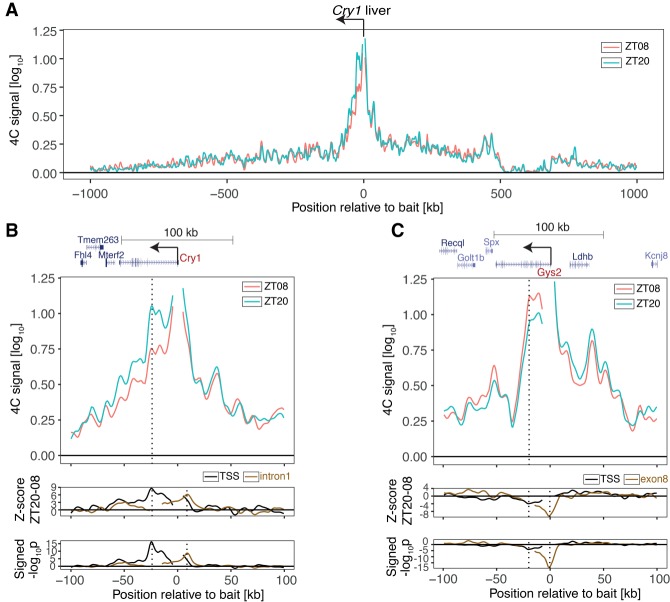
Figure 1.
Rhythmic chromatin interactions in mouse livers. (A) 4C-seq data (LWMR summarizes n = 4 animals per group) in a 2-Mb genomic region surrounding Cry1 at ZT08 and ZT20. (B) 4C-seq signals in a 200-kb genomic region surrounding Cry1 at ZT08 and ZT20. (Bottom tracks) Z-score and signed −log10(p) show rhythmic contacts between the promoter region and the intronic region. (Black) Cry1 TSS bait (P < 10−16 at peak); (brown) Cry1 intron1 bait (P < 10−8 at peak). (C) Same as B, targeting the Gys2 promoter. (Bottom tracks) Same as B for Gys2 TSS bait (P < 10−4 at peak). (Brown) Gys2 exon8 bait (P < 10−18 at peak). Vertical dotted lines show the positions locally of maximal differential chromatin interactions.

