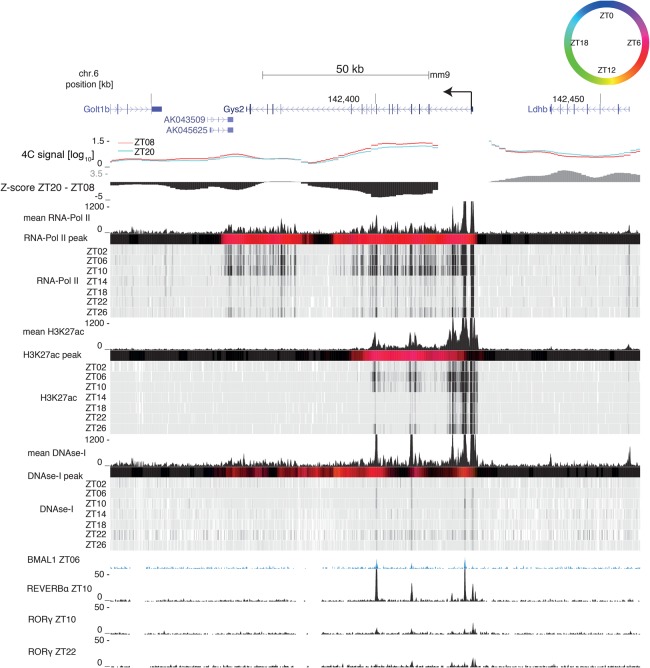
Figure 4.
The rhythmic Gys2 loop connects the promoter with a H3K27ac-marked enhancer. The Gys2 genomic region containing 4C-seq signals from the Gys2 TSS at ZT08 (red) and ZT20 (blue) and Z-score (ZT20–ZT08) in wild-type livers. RNA Pol II loadings (ChIP-seq), H3K27ac mark (ChIP-seq), and DNase-I signal are from Sobel et al. (2017). Temporally averaged signals and temporal signals of each mark are plotted. Colored bars represent peak times according to the color legend at the top right; black signifies no rhythm (Materials and Methods). The BMAL1 ChIP-seq signal is from Rey et al. (2011), and the REV-ERBα and RORγ ChIP-seq signals are from Zhang et al. (2015).

