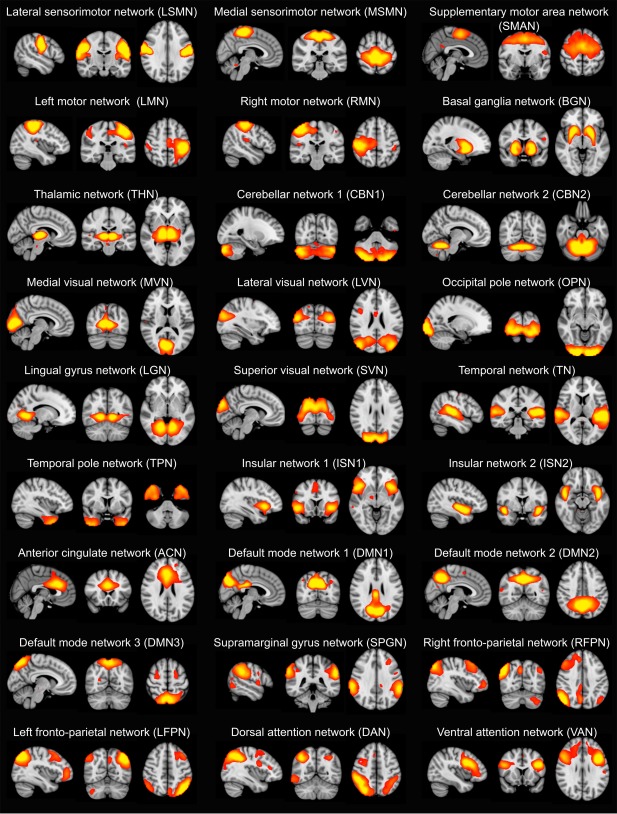
Figure 1.

Spatial maps of the 27 resting‐state networks (RSNs) obtained from the independent healthy control group. RSN maps are thresholded at 3 < z < 12. Images are shown in radiological convention, that is, the left side of the image corresponds to the right hemisphere [Color figure can be viewed at http://wileyonlinelibrary.com]
