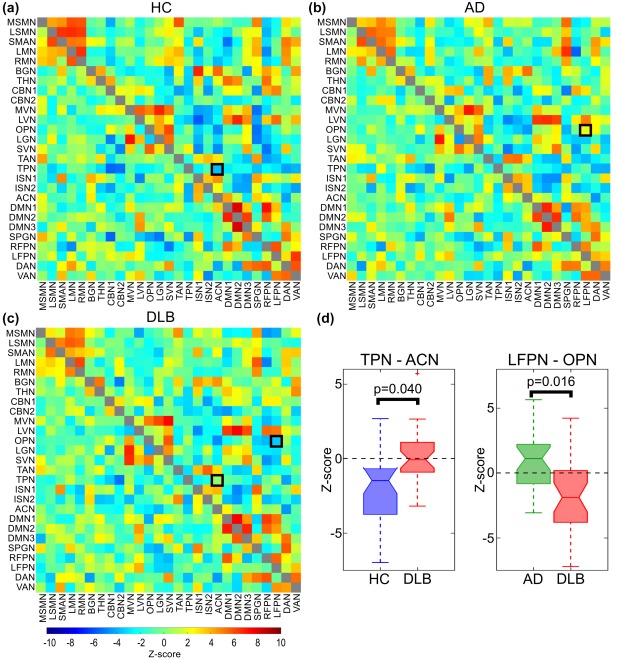
Figure 3.

Correlation matrices from FSLNets analysis for (a) HC, (b) AD, and (c) DLB. Upper triangular matrices show full correlations while partial correlations are plotted in the lower triangular matrices. (d) Boxplots show z scores for edges with significant group differences for full correlations (black squares in panel a–c, p < .05, FWE corrected for multiple comparisons). OPN, occipital pole network; LFPN, left fronto‐parietal network; TPN, temporal pole network; ACN, anterior cingulate network [Color figure can be viewed at http://wileyonlinelibrary.com]
