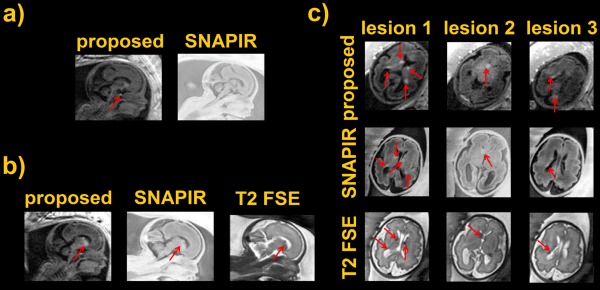
Figure 9.

(a) Proposed sequence versus standard SNAPIR. Fetal pituitary is indicated by the red arrow. (b,c) Sagittal scans comparing 2D MP‐RAGE, SNAPIR, and a T2 single‐shot acquisition. Arrows indicate the location of pathology consistent with a diagnosis of tuberous sclerosis. The SNAPIR sequence was acquired at a resolution of 1 × 1 × 4 mm³ with TI of 400 ms. The T2 single shot scan at 1.25 × 1.25 × 2.5 mm³ with a TE of 180 ms and a TR of 30.9 s.
