
Figure 2.
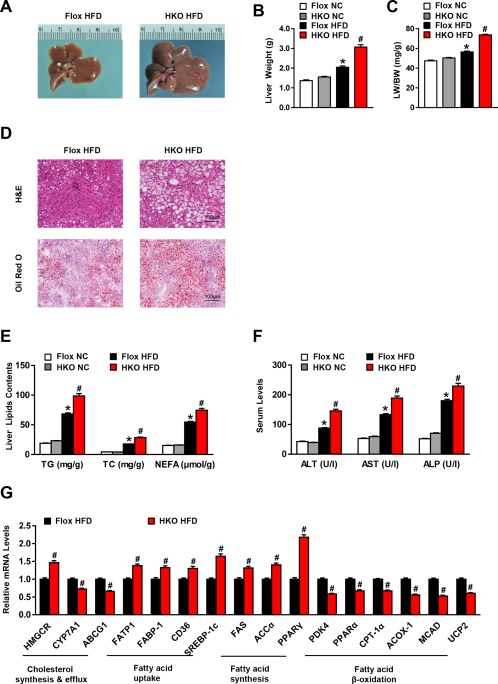
LILRB4 ablation in hepatocytes aggravates hepatic steatosis. (A) Representative images of the livers from LILRB4‐Flox and LILRB4‐HKO mice after 12 weeks of HFD treatment (n = 4 mice in each group). (B, C) Liver weight (B) and ratio of liver weight to body weight (LW/BW) (C) of LILRB4‐HKO mice and their littermate Flox controls after 12 weeks of NC or HFD feeding (n = 18 and 23 for each group). (D) Representative H&E (upper) and Oil Red O (bottom) staining of liver sections of LILRB4‐Flox and LILRB4‐HKO mice subjected to HFD feeding for 12 weeks (n = 4 mice for each group). Scale bar: 100 μm. (E) Content of TG, TC, and NEFA in the livers of LILRB4‐Flox and LILRB4‐HKO mice after 12 weeks of NC or HFD treatment (n = 18 and 23 mice in each group). (F) Levels of ALT, AST, and ALP in the sera of HFD‐ or NC‐fed mice with LILRB4 deficiency and control mice (n = 18 and 23 mice in each group). (G) mRNA expression levels of lipid metabolism‐related genes in the livers of LILRB4‐Flox and LILRB4‐HKO mice after 12 weeks of HFD feeding (n = 4 mice for each group). The expression of tested genes was normalized to that of β‐actin. *P < 0.05 versus Flox/NC; # P < 0.05 versus Flox/HFD.