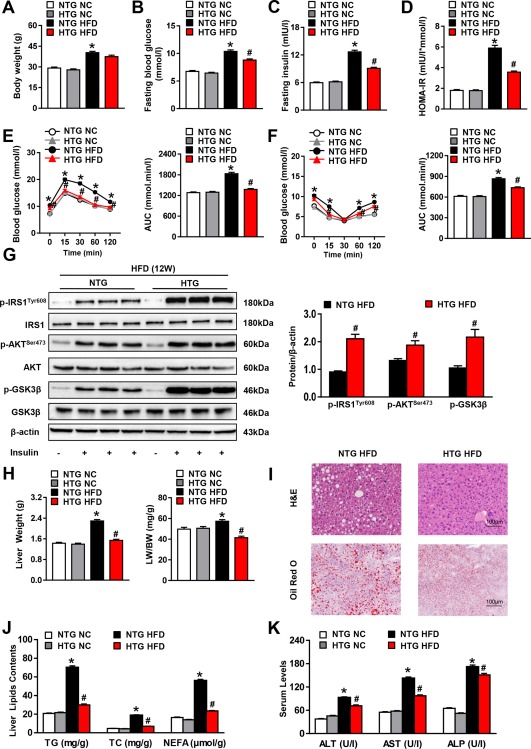
Figure 3.

Hepatocyte LILRB4 overexpression ameliorates insulin resistance and hepatic steatosis induced by HFD. (A‐D) Body weight (A), fasting blood glucose (B), fasting serum insulin (C) and HOMA‐IR (D) values of mice with the hepatocyte‐specific overexpression of LILRB4 and their NTG controls after HFD or NC treatment for 12 weeks (n = 14 and 20 for each group). (E, F) Blood glucose levels of NTG and LILRB4‐HTG mice according to GTT (E) and ITT (F) at 11 weeks after HFD treatment (n = 14 and 20 mice in each group for each test). (G) The protein expression of total and phosphorylated IRS1, AKT, and GSK3β in the livers of NTG and LILRB4‐HTG mice at 12 weeks after HFD treatment (n = 4 mice for each group). (H) Liver weight and ratio of liver weight to body weight (LW/BW) of mice in the NTG and LILRB4‐HTG groups after 12 weeks of NC or HFD feeding (n = 14 and 20 mice in each group). (I) Representative images of H&E and Oil Red O–stained liver sections of NTG and LILRB4‐HTG mice after HFD feeding for 12 weeks (n = 4 mice for each group). Scale bar: 100 μm. (J) Hepatic contents of TG, TC, and NEFA of mice in the indicated groups (n = 14 and 20 mice in each group). (K) Serum levels of ALT, AST, and ALP of mice in the NTG and LILRB4‐HTG groups after NC or HFD treatment for 12 weeks (n = 14 and 20 mice for each group). *P < 0.05 versus NTG/NC; # P < 0.05 versus NTG/HFD.
