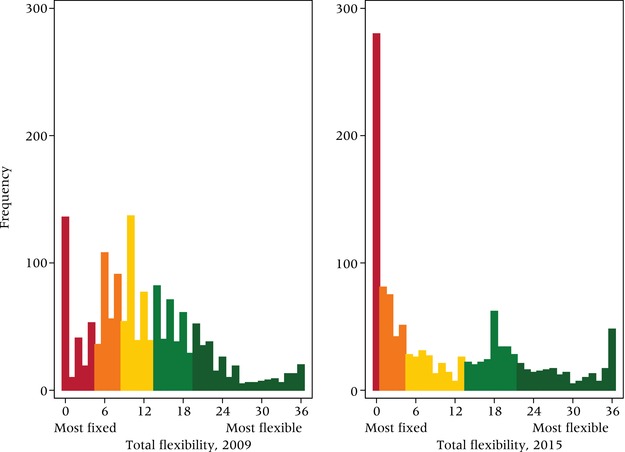
Figure 6.

Levels of flexibility among young women in Balaka, 2009 and 2015
NOTE: Figure shows quintiles from most fixed to most flexible.
N=1,200.
SOURCE: Tsogolo la Thanzi.

Levels of flexibility among young women in Balaka, 2009 and 2015
NOTE: Figure shows quintiles from most fixed to most flexible.
N=1,200.
SOURCE: Tsogolo la Thanzi.