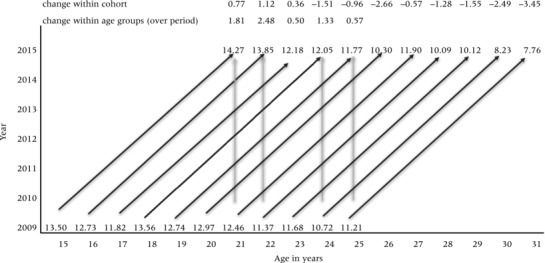
Figure 7.

Age‐standardized view of flexibility level using a modified Lexis diagram
NOTE: The Lexis diagram summarizes change in the average flexibility score (range 0–36) between 2009 and 2015 for each single‐year birth cohort. Comparisons can be made for each cohort over time (diagonal lines) or for age groups (e.g., 21‐year‐olds) at the two points in time (vertical lines). For example, the average flexibility level among 21‐year‐olds rose from 12.46 in 2009 to 14.27 in 2015 (change of 2.48). Among respondents who were 25 in 2009, flexiblity levels averaged 11.21 but dropped to 7.76 by 2015 (change of –3.45).
SOURCE: Tsogolo la Thanzi, Wave 1 (2009) and TLT‐2 (2015).
