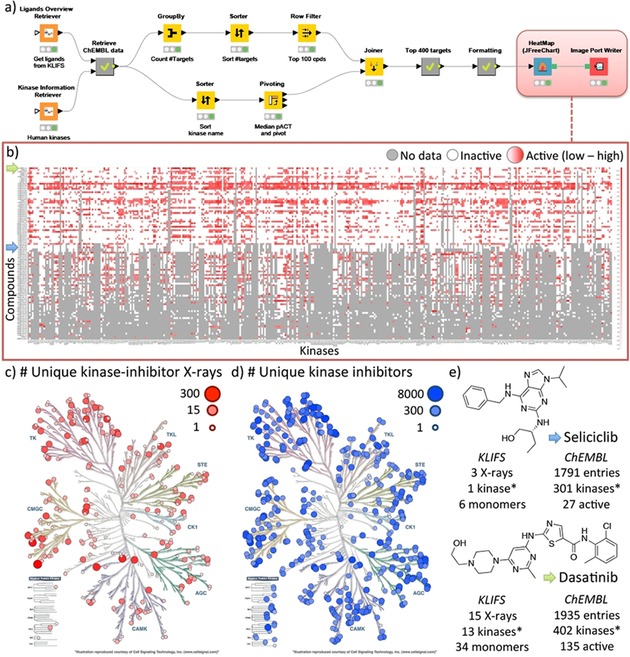
Figure 2.

Structure‐based bioactivity data mapping workflow (A) of kinase inhibitors using both the KLIFS and the ChEMBL database. The heatmap (B) shows the bioactivity profile for the top 100 co‐crystallized kinase ligands with the largest amount of data available for the top 400 kinases. The kinomes, created with KinMap,32 show the number of unique kinase‐inhibitor complexes based on KLIFS (C) and the number of unique kinase inhibitors based on ChEMBL (D). The data accumulated in this workflow are summarized (E) for two well‐known kinase inhibitors, namely Seliciclib and Dasatinib (indicated with a blue and green arrow, respectively on the Y‐axis of the heatmap). *Only human kinases are listed.
