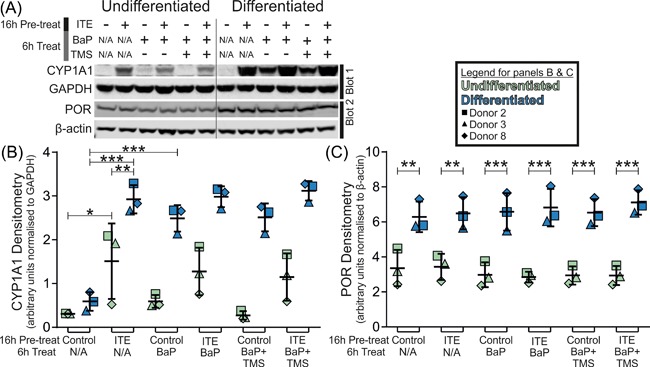
Figure 4.

Western blotting of CYP1A1 normalized to GAPDH; and POR normalized to β‐actin in NHU cell cultures. CYP1A1 was significantly inducible in undifferentiated cells and differentiated cultures (4.9 and 5.0‐fold; P < 0.05 and P < 0.001, respectively) but reached significantly greater ITE‐induced abundance in differentiated cells (1.9‐fold P < 0.01). BaP exposure alone did not induce CYP1A1 expression in undifferentiated cells but did significantly in differentiated cultures (4.2‐fold; P < 0.001). POR expression was on average 2.2‐fold (P < 0.01) higher in differentiated cultures, but did not respond significantly to either ITE or BaP exposure. Results are presented as mean ± SD (n = 3 independent donor cell lines) with significance in expression assessed by ANOVA with Tukey‐Kramer post‐test. Representative Western blots shown from single donor. N/A, not applicable
