Figure 5.

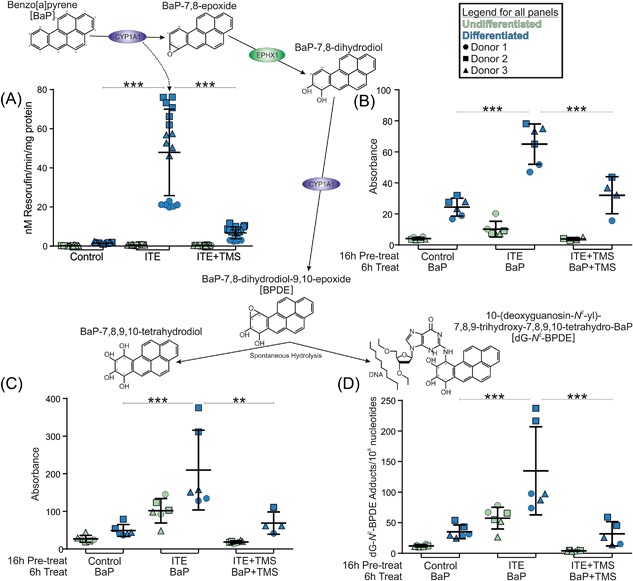
Schematic illustrating the metabolism of BaP by CYP1A1 with graphs showing data supporting active metabolism of BaP by differentiated NHU cells. (A) EROD activity was negligible in undifferentiated cultures. In differentiated NHU cells EROD was induced by 16 h 1 μM ITE pre‐treatment (42‐fold; P < 0.001) and inhibited to 14% of peak activity by 12 μM TMS (P < 0.0001). n = 3 independent donor cell lines; six replicate experiments per donor. (B) HPLC analysis of BaP‐7,8‐dihydrodiol in NHU cultures exposed to 2 μM BaP for 6 h. A total of 1 μM ITE pre‐treatment of differentiated NHU cells significantly increased the abundance of BaP‐7,8‐dihydrodiol in the culture medium compared to controls (2.7‐fold; P < 0.05) and 12 μM TMS reduced this to 46% (not significant). n = 3 independent donor cell lines; duplicate replicate experiments per donor. Representative chromatograms of the HPLC analysis are shown in Supplementary Figure 4. (C) HPLC analysis of BaP‐tetrol‐I‐1 in NHU cultures exposed to 2 μM BaP for 6 h. A total of 1 μM ITE pre‐treatment of differentiated NHU cells significantly increased the abundance of BaP‐tetrol in the culture medium compared to controls (4.1‐fold; P < 0.01) and 12 μM TMS significantly reduced this to 35% of induced levels (P < 0.05). Results are presented as mean ± SD (n = 3 independent donor cell lines; duplicate replicate experiments per donor). Representative chromatograms of the HPLC analysis are shown in Supplementary Figure 4. (D) 32P‐postlabeling analysis of BaP‐DNA adducts in NHU cultures exposed to 2 μM BaP for 6 h. A total of 1 μM ITE pre‐treatment of differentiated NHU cells significantly increased the number of dG‐N 2‐BPDE adducts per 108 nucleotides compared to controls (3.7‐fold; P < 0.001) and 12 μM TMS significantly reduced this (to 21% of induced levels; P < 0.001). n = 3 independent donor cell lines; duplicate experiments per donor. Representative autoradiograms showing the DNA adduct profiles obtained by 32P‐postlabeling are shown in Supplementary Figure S5. For all panels, results are presented as mean ± SD, significance was assessed by ANOVA with Tukey‐Kramer post‐tests and cell lines from the same three donors were used for all graphs/biological end‐points
