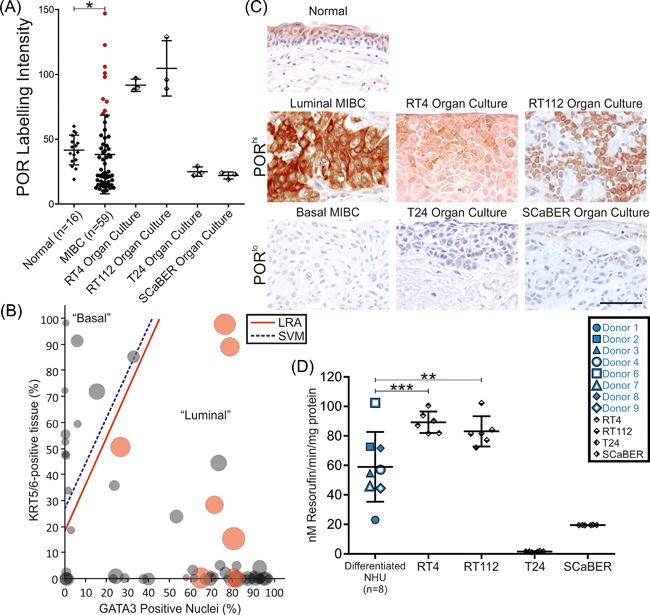
Figure 6.

Analysis of NADPH:P450 oxidoreductase (POR) expression and CYP‐activity in bladder cancer. (A) Immunoperoxidase labeling of POR was quantified in a group of “normal” non‐neoplastic bladders (n = 16) and compared with muscle‐invasive bladder cancer (MIBC; n = 59) and organoid models of bladder cancer selected to represent POR suppressed (T24 and SCaBER) and over‐expressing (RT4 and RT112) tumors. MIBC showed significant (P < 0.05, Mann‐Whitney U‐test) suppression of mean POR expression; however, a group of outliers was noted which over‐expressed POR (open circles, representing 11.9% of cases). (B) Classification of MIBC as either luminal or basal based on quantification of GATA3 and KRT5/6 immunoperoxidase labeling was performed according to Dadhania et al33, reproducing the logistic regression analysis (LRA) and support vector machine (SVM) cut‐off lines derived in that study. All POR over‐expressing tumors (red circles) were classified as the more differentiated luminal type of MIBC. (C) Micrographs illustrating the POR immunoperoxidase labeling of normal bladder, MIBC, and cancer cell line (RT4, RT112, T24, and SCaBER) organ culture samples described in panel A. Scale bar represents 50 μm and applies to all images. (D) T24 and SCaBER cells generated peak EROD‐activity of 1.6 and 19.5 nM resorufin/min/mg, respectively following ITE exposure. By contrast, 1 μM ITE‐induced a peak EROD‐activity of 89.3 and 83.1 nM resorufin/min/mg in the POR over‐expressing RT4 and RT112 cell lines, respectively. RT4 and RT112 EROD was significantly higher than the mean of 60.0 nM resorufin/min/mg observed for differentiated NHU cells (n = 8 donors; each data point is the mean of six replicate cultures per donor)
