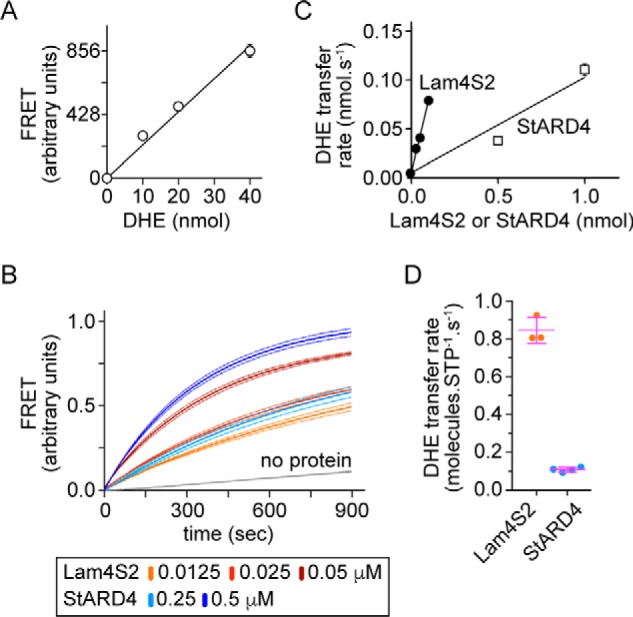
Figure 5.

Quantification of Lam4S2-mediated DHE transport between anionic liposomes. A, calibration plot showing the extent of FRET as a function of the amount of DHE in acceptor liposomes. Acceptor liposomes containing dansyl-PE (3 mol % of total lipid) and different amounts of DHE (0–40 nmol) were placed in a cuvette (at a concentration of 100 μm phospholipid in a total volume of 2 ml), and sensitized emission of dansyl-PE was measured using λex = 310 nm and λex = 525 nm. The graph shows the recorded fluorescence emission (scaled by 1:1000) and a linear regression analysis. Data points represent the mean ± S.E. of three independent experiments; for most of the data points the error bars are smaller than the size of the symbol. B, FRET between DHE and dansyl-PE resulting from Lam4S2- or StARD4-dependent DHE transport from donor to acceptor liposomes. The traces are normalized to the plateau value of FRET determined as described under “Experimental procedures”. Dotted lines represent the mean ± S.E. of three independent experiments. C, rate of DHE transport as a function of the amount (in nmols) of Lam4s2 or StARD4. Data points represent the mean ± S.E. of three independent experiments; for most of the data points the error bars are smaller than the size of the symbol. D, comparison of transfer rate (nmol/s) per protein (nmol) between Lam4s2 and mStarD4. Individual measurements are shown (dots) along with the mean and S.D. (error bars). STP, sterol transport protein.
