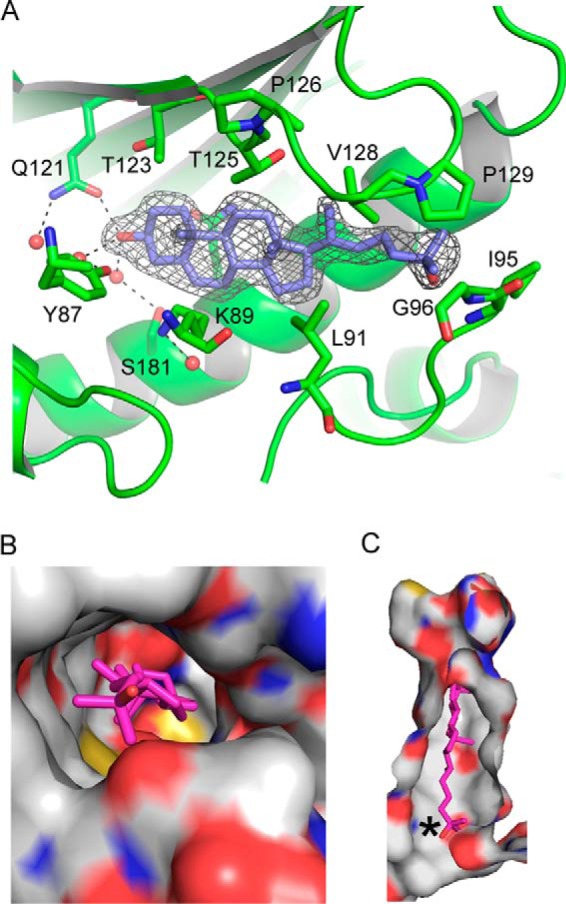
Figure 7.

The sterol-binding cavity in Lam4S2. A, difference electron density map (Fo − Fc) calculated in the absence of the ligand for the sterol-bound structure and contoured at 3σ. Modeled 25-hydroxycholesterol is shown in stick representation with carbons colored blue. Dotted lines emphasize the hydrogen bond network surrounding the 3-OH moiety. B, top view of the sterol-binding site shown in surface representation, revealing the positioning of the 25-OH group at the entry site. The protein is colored by atom type with carbons white; bound sterol is shown in stick representation and colored magenta. C, a slice through the binding pocket. The color scheme is as in B; an asterisk marks the tip of the isooctyl tail of the sterol molecule.
