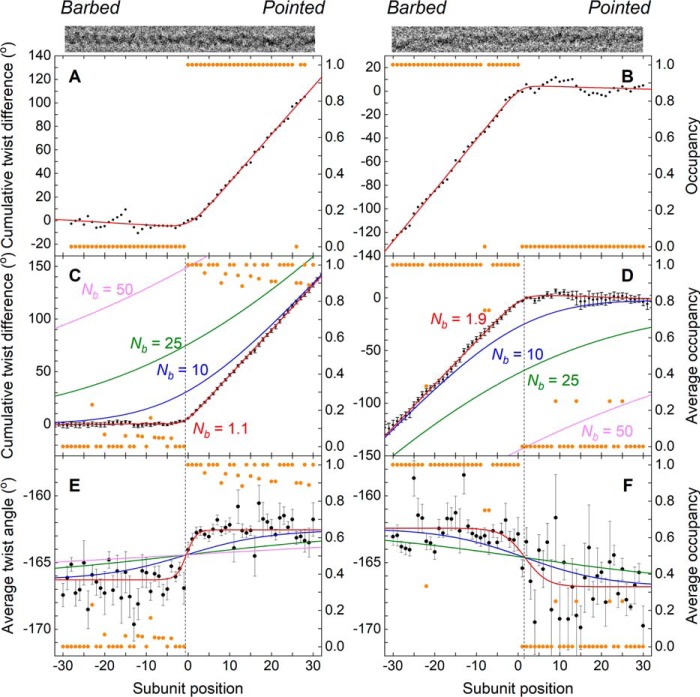
Figure 2.
Actin filament twist changes abruptly at boundaries between bare and cofilin-decorated segments. Results shown are for pyrene-labeled actin samples. Nearly identical behavior was observed with unlabeled actin, as described in the text. A, for an imaged filament with a boundary (top), the “net twist difference” (i.e. the excess twist with respect to a canonical bare actin filament, accumulated subunit-by-subunit starting from the left (barbed end)), is plotted together with the single-site cofilin occupancy. An abrupt, “hockey stick” transition from a measured excess twist value of ∼0° per subunit (corresponding to bare actin) to a value of ∼4° per subunit (corresponding a cofilin-decorated actin filament) coincides with the cofilin cluster boundary (n = 0). B, results similar to A for a filament where bare actin was found on the pointed-end side of a cluster and the accumulated “net twist difference” was calculated starting from the pointed end. C, quantities in A (cumulative net twist difference and cofilin occupancy) are averaged for 24 filaments where bare actin was found on the barbed-end side of a cofilin cluster. The error bar for the nth estimate of the cumulative net twist difference is about the same as the error of nth φ value, and the smooth red curve corresponds to the best fit of the data to an empirical function (integral of a sigmoid function; see “Experimental procedures”), which yields an estimate for the characteristic decay length of the twist transition, Nb, of 1.1 ± 0.1. Three other smooth curves (blue, green, and magenta) simulate conditions where Nb is constrained to (larger) values reported in the literature. D, results similar to C for four filaments where bare actin was found on the pointed-end side of a cluster. The fitted value for Nb was 1.9 ± 0.3. E, average axial rotation between subunits n and n − 1 for the population of 24 filaments in C. The smooth red curve represents the best fit of the data to an empirical sigmoid function (see “Experimental procedures”), yielding estimates for Nb (1.1 ± 0.3), the average twist for cofilactin (−162.6° ± 0.1) and the average twist for bare actin (−166.3° ± 0.2). This analysis reveals that the transition from the axial rotation corresponding to canonical actin to that of fully decorated cofilactin occurs within 1–2 subunits from the boundary. F, average axial rotation for the population of four filaments in D, and the corresponding fitted sigmoid function (yielding parameter estimates for Nb (2.6 ± 1.6), the average relative twist for cofilactin (−162.4° ± 0.4), and the average relative twist for actin (−166.8° ± 0.4). Magnitudes of the uncertainty bars are larger than in E due to smaller sample size; nevertheless, the transition in axial rotation value is localized to no more than 1–2 subunits. Smooth curves in E and F depict simulations where Nb is constrained to previously reported values, as in C and D. Note that in a minority of cases (33/97 for unlabeled actin and 10/38 for pyrene-labeled actin), the precise position of the boundary could not be unambiguously determined based on the classification results; such cases were therefore excluded from detailed twist analysis.

