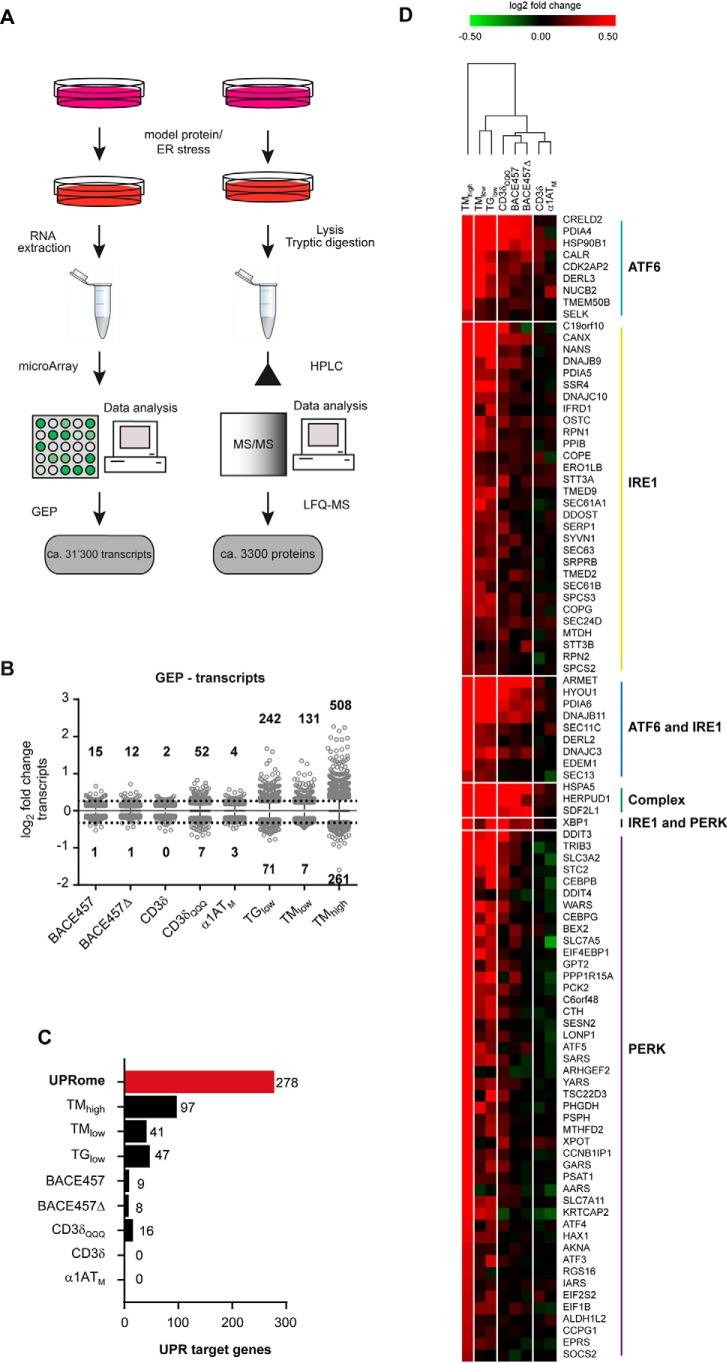
Figure 2.
Transcriptional responses to ER stress–inducing chemicals and unfolded proteins. A, schematic representation of the workflow for GEP (left) and LFQ-MS (right). B, distribution of fold-changes from GEP data. Numbers on top and bottom show the number of significantly up- and down-regulated transcripts (p < 0.05, fold-change >20%) in each condition, dashed line shows the ±20% fold-change. Shown are only values outside the 1–99 percentile range. C, histogram showing the number of significantly up-regulated UPR target genes. UPRome (red) are all UPR target genes as defined based on literature (see text). D, hierarchical clustering based on the 97 UPRome genes up-regulated by TMhigh and shown as a heat map. Genes are ordered based on their dependence from the different UPR branches (colored lines on the right).

