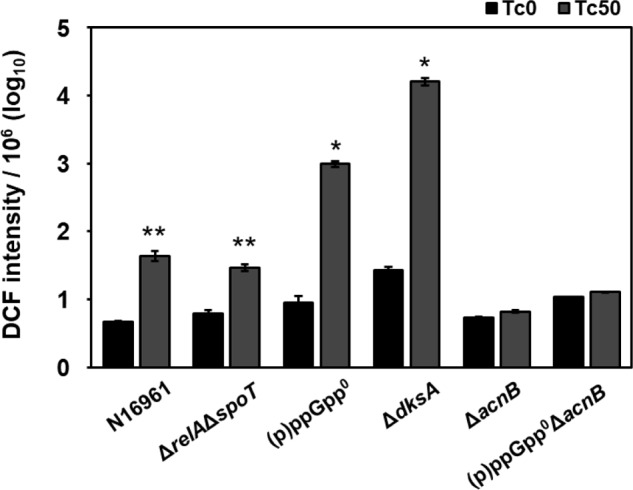
Figure 7.

Antibiotic-induced ROS production in (p)ppGpp-deficient mutant strains. Bacterial strains indicated at the bottom were treated with 50 μg/ml Tc for 1 h (gray bars) or left untreated (black bars). Following treatment, bacterial cells were stained with 50 μm DCF for 30 min to measure intracellular ROS levels. DCF intensity was normalized with bacterial cfu and is displayed in logarithmic scale. *, p < 0.0001 versus values of untreated groups. **, p < 0.001 versus values of untreated groups. Error bars, S.D.
