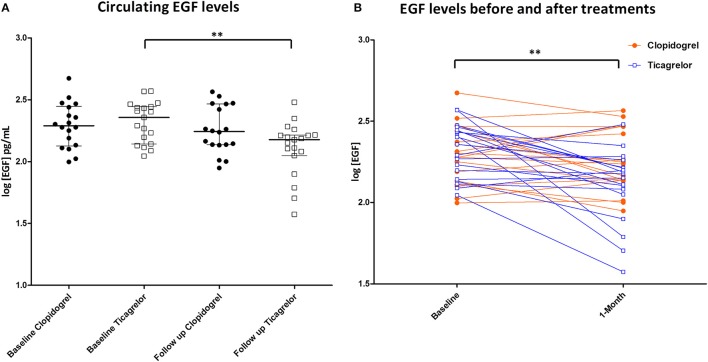
Figure 1.
(A) EGF levels in the serum of patients at baseline and after 1 month of treatment. Black circle: patient randomized to clopidogrel. White square: patient randomized to ticagrelor. **P < 0.01; (B) EGF levels of patients representation before and after treatments. Orange circle: patient randomized to clopidogrel. Blue squares: patient randomized to ticagrelor. **P < 0.01.

