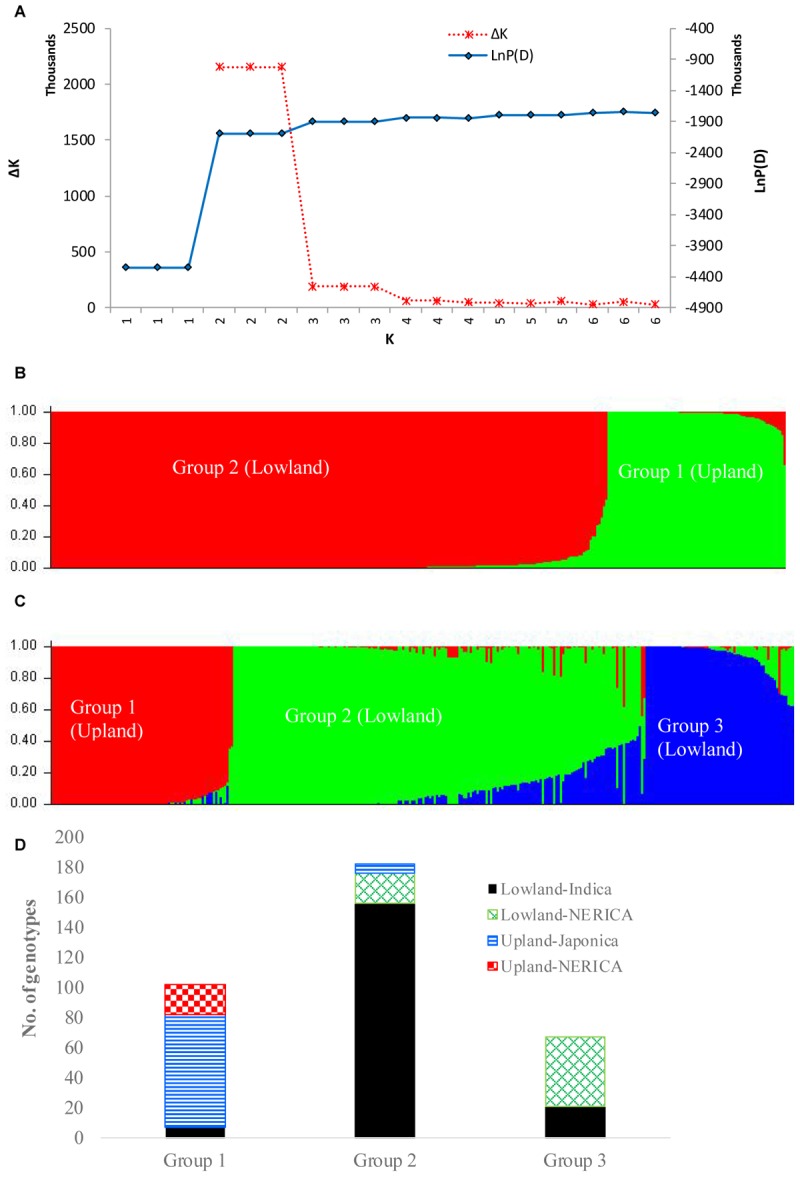
FIGURE 4.

Population structure of 330 rice genotypes based on 15,020 SNP markers: (A) plot of LnP(D) and an ad hoc statistic ΔK calculated for K ranging from 1 to 6, with each K repeated thrice; (B) population structure at K = 2; (C) population structure at K = 3; and (D) number of lowland and upland NERICA, indica, and japonica genotypes that belong to each of the three groups predicted based on STRUCTURE at K = 3. In both (B,C), each genotype is represented by a single vertical line that is partitioned into K colored segments in the x-axis, with lengths proportional to the estimated probability membership value (y-axis) at each of the K inferred clusters. See Supplementary Table S1 for group membership.
