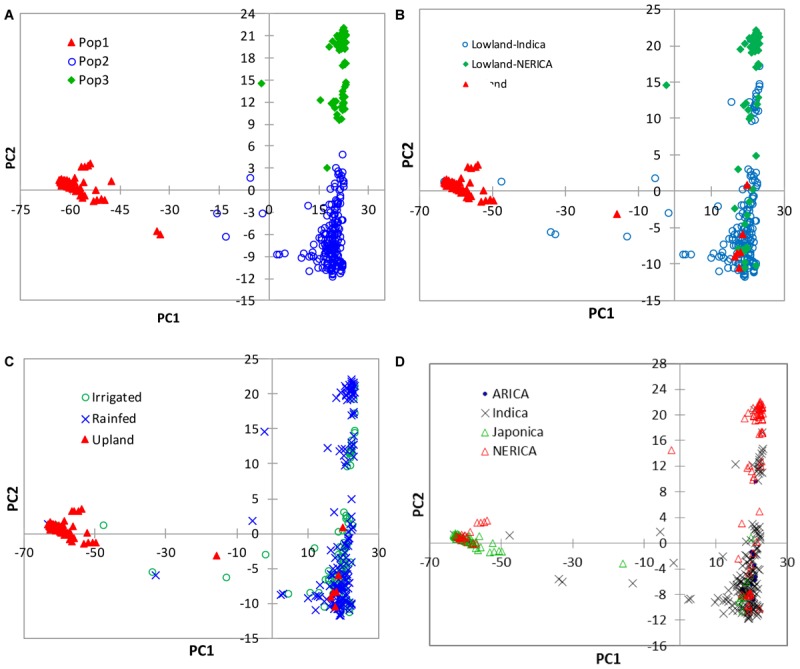
FIGURE 5.

Plots of PC1 (56.7%) and PC2 (4.4%) from PCA analyses of 330 rice genotypes based on 15,020 SNPs. The plots were made using (A) group membership obtained from the model-based STRUCTURE at K = 3, (B) the lowland indica, lowland NERICA and upland ecologies, and (C) the irrigated lowland, rainfed lowland and upland ecologies, and (D) the different subspecies/types of rice. See Supplementary Table S1 for details.
