FIGURE 6.

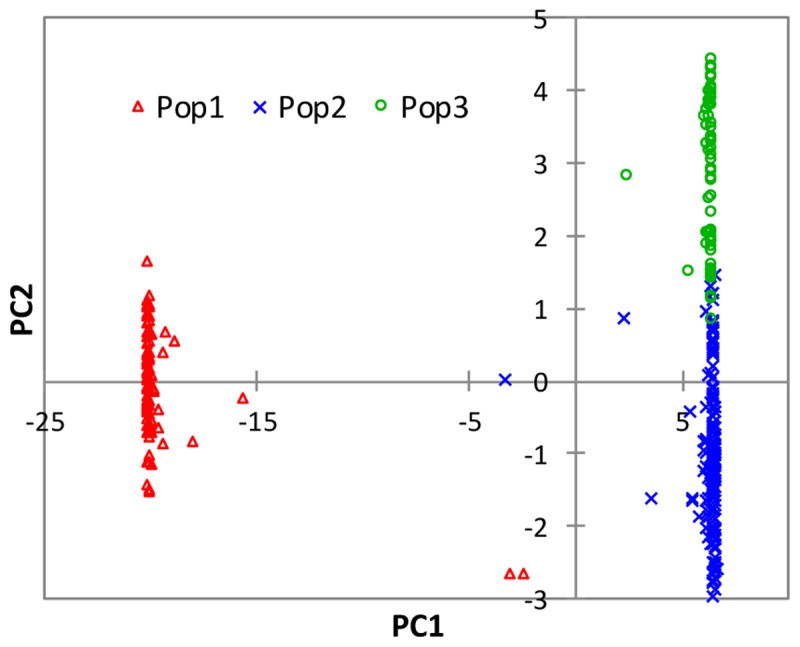
Plots of PC1 (73.1%) and PC2 (1.9%) from PCA analyses of 330 rice genotypes based on 1,197 SNPs that showed significantly different (p < 0.05) FST values between the lowland and upland ecologies. See Supplementary Table S1 for details.

Plots of PC1 (73.1%) and PC2 (1.9%) from PCA analyses of 330 rice genotypes based on 1,197 SNPs that showed significantly different (p < 0.05) FST values between the lowland and upland ecologies. See Supplementary Table S1 for details.