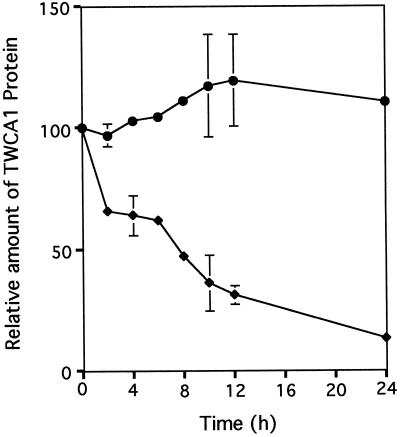
Figure 4.
Time course of TWCA1 decrease in response to increased CO2 concentration. Cultures were preadapted to 100 μatm CO2. At t = 0, experimental cultures were shifted to 750 μatm CO2 and samples were withdrawn at the times indicated. Relative amounts of TWCA1 were determined by western analysis and phosphorimaging. All values were normalized to that of the initial timepoint (t = 0). The graph represents the average of two separate experiments. ●, 100 μatm CO2; ♦, 750 μatm CO2.

