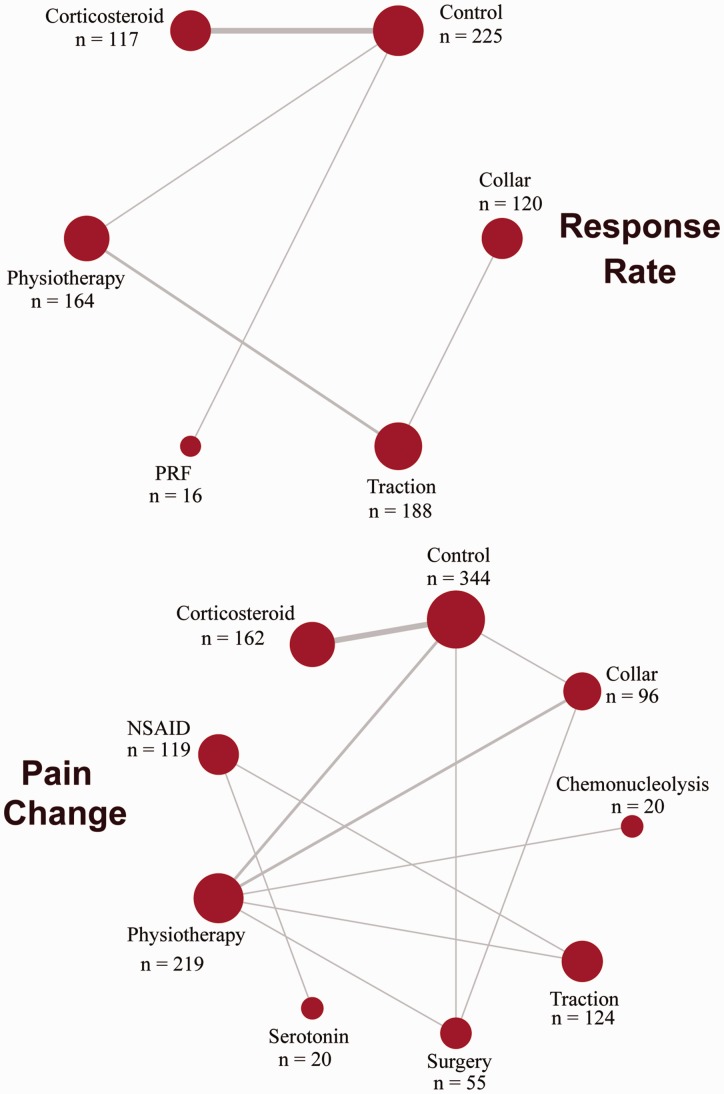
Figure 2.
Network of response rate and pain change. Lines represent direct comparisons between two interventions. The thicker the line is, the greater the number of existing direct comparisons between the two interventions. Numbers above dots show the total number of patients for each intervention.
NSAID: non-steroidal anti-inflammatory drugs; PRF: pulsed radiofrequency.

