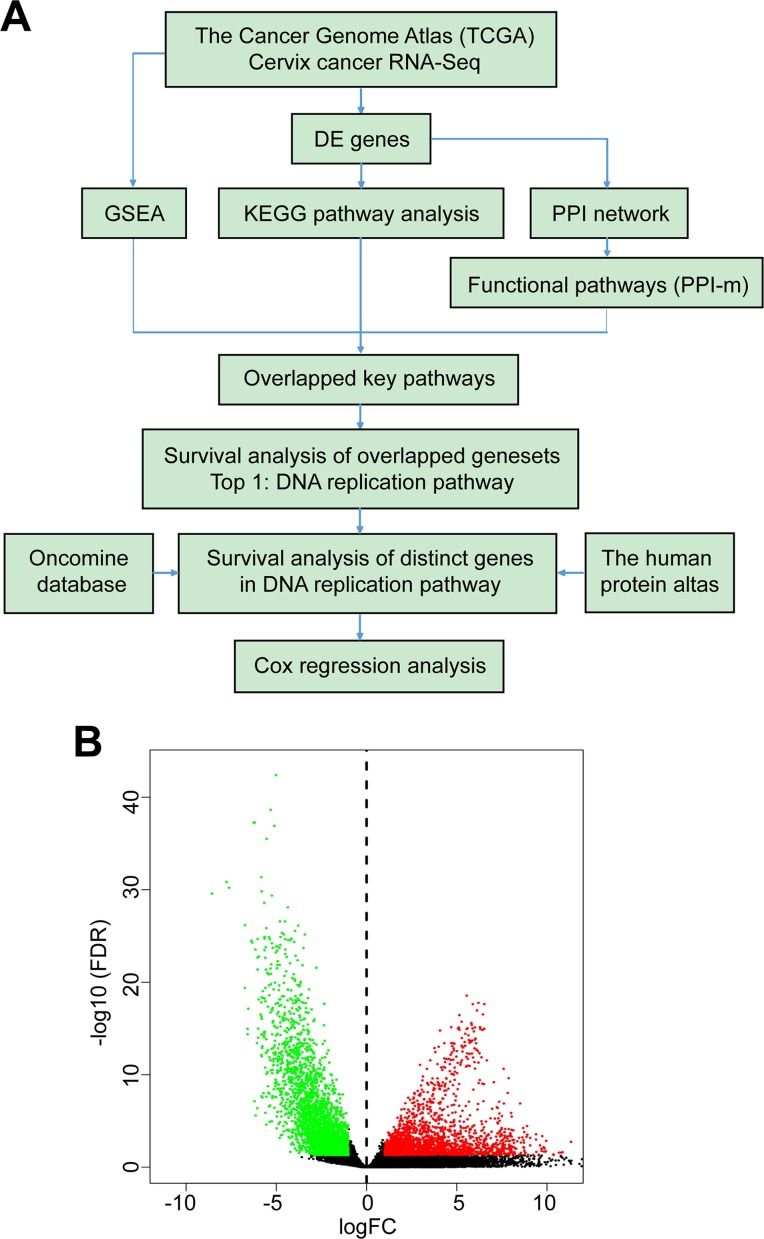
Figure 1.
Identification of DEGs. A, Flowchart of the bioinformatics work included in this research. Data were collected from TCGA database, Oncomine, and also THPA. B, Volcano plot of DEGs, each dot represents 1 gene, and colorized genes had statistical significance (log-fold change >1; red, upregulated genes; green, downregulated genes). DEG indicates differentially expressed genes; TCGA, The Cancer Genome Atlas; THPA, The Human Protein Atlas.

