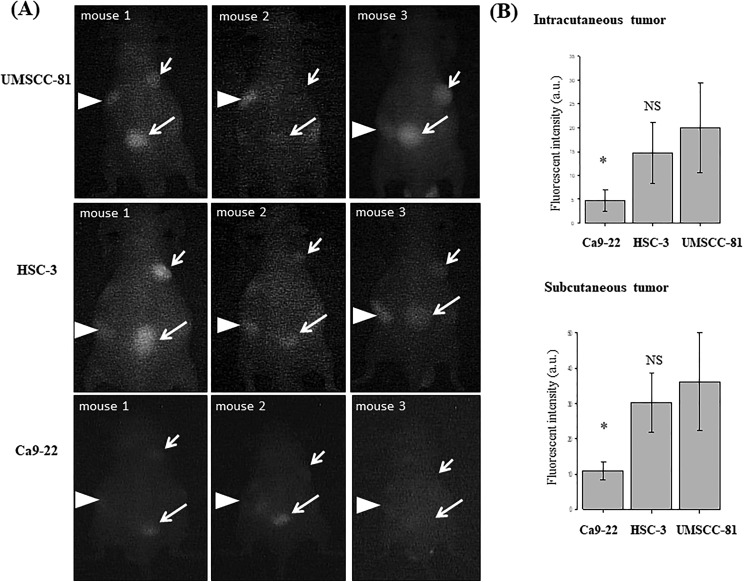
Figure 5.
Comparison of real-time NIR images of 3 OSCC-xenografted tumors in mice using the ICG-labeled anti-podoplanin antibody and a handheld detection device (PDE). A, Real-time NIR images (dark field) of 3 OSCC intracutaneous (short arrows) and subcutaneous tumors (long arrows) in mice (n = 4). Arrowheads indicate the liver. B, Quantitative analysis of NIR fluorescence intensity of UMSCC-81, HSC-3, and Ca9-22 intracutaneous and subcutaneous tumors. Bar = standard deviation. * P < .05 compared with the UMSCC-81 tumors. AU indicates arbitrary units; NIR, near-infrared; NS, not significant; PDE, photodynamic eye; OSCC, oral squamous cell carcinoma.

