
Figure 1.
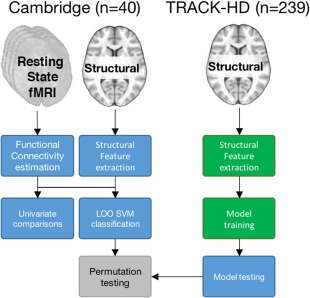
High‐level schematic of the analysis approach. In the Cambridge cohort, both resting‐state fMRI and structural images were available, only structural images were available for the TRACK‐HD cohort. Colors represent the independent samples used for different aspects of the analysis (blue = Cambridge cohort [19 preHD, 21 controls]; green = TRACK‐HD cohort [118 preHD, 121 controls]). fMRI = functional magnetic resonance imaging; SVM = support vector machine.