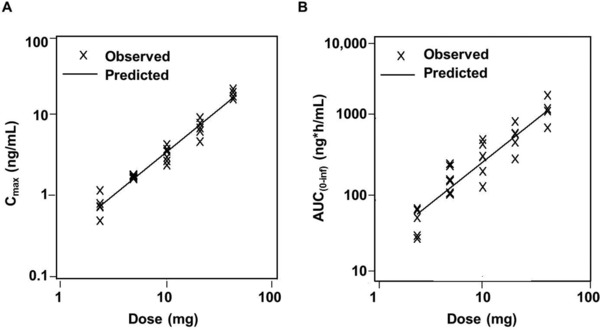
Figure 1.

Dose–exposure relationship of vortioxetine (study 1A). Analysis of vortioxetine (A) Cmax and (B) AUC0–inf exposure by dose using a power model (Y = α × DOSEβ). In this model, the exponent (β) is the slope and measure of dose proportionality, which is achieved when β = 1. AUC0–inf, area under the plasma concentration–time curve from time 0 to infinity; Cmax, maximum observed plasma concentration.
