
Figure 3.
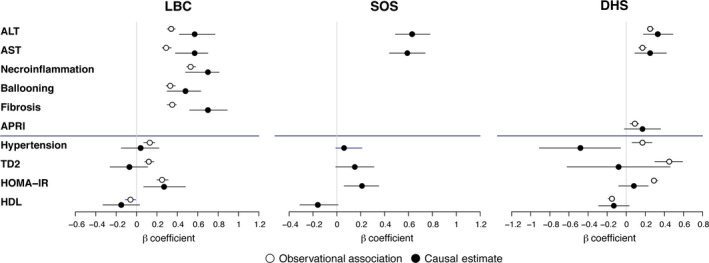
Comparison of the epidemiological association of observed hepatic fat with NAFLD features (open circles) with the causal association of hepatic fat with NAFLD‐related features (filled circles) in the LBC (n = 1515, panel a), the SOS (n = 3329, panel b) and the DHS (n = 2736, panel c). T2D, type 2 diabetes; HOMA‐IR, homoeostasis model assessment‐insulin resistance index; HDL, high‐density lipoprotein; ALT, alanine aminotransferases; AST, aspartate aminotransferases. Results were adjusted for age, sex, BMI, modality of recruitment in the LBC and ethnicity in the DHS, use of statins and (for the metabolic parameters) the severity of liver fibrosis. Estimates are beta coefficients, and error bars are 95% confidence intervals.