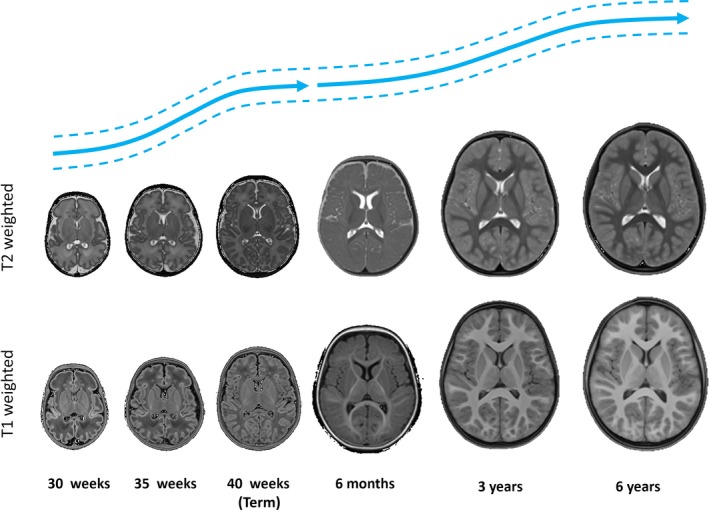
Figure 1.

T1‐ and T2‐weighted images at different age points throughout the perinatal and early childhood period. Illustrative growth curves for the two periods (adapted from Makropoulos et al., 2016 and Dean III, Dirks et al., 2014) are shown above in blue [Colour figure can be viewed at http://wileyonlinelibrary.com]
