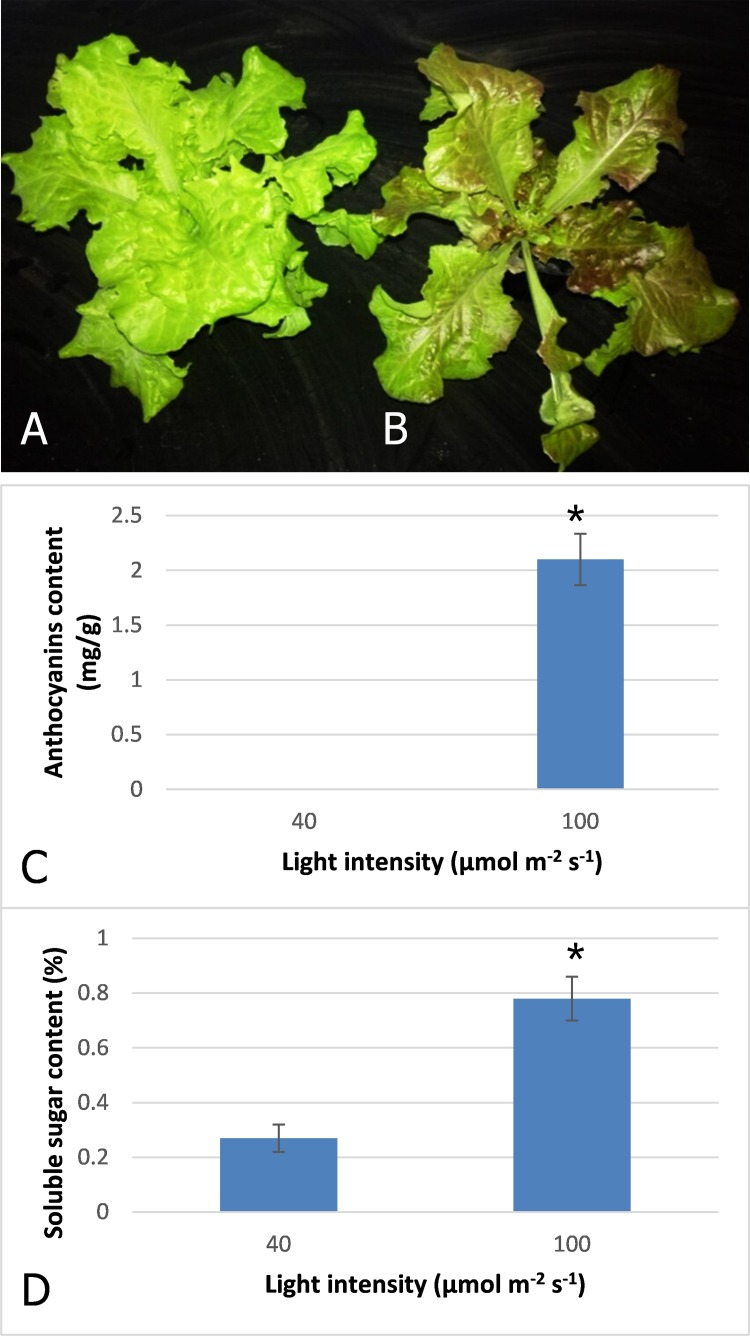
Figure 1. Color difference of red leaf lettuce.
(A) Plant was grown under 40 μmol m−2 s−1 light as the control. (B) Plant was irradiated under 100 μmol m−2 s−1 light after three days. (C) Anthocyanins content of red leaf lettuce under different light intensity. (D) Soluble sugar content of red leaf lettuce under different light intensity. Photo credit: Yanzhao Zhang.

