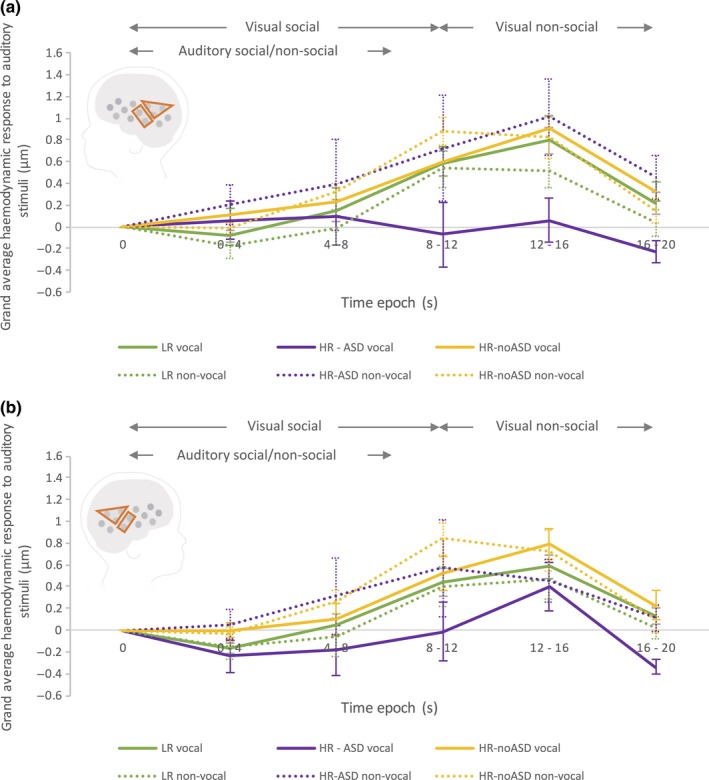
Figure 3.

Grand averaged HbO2 haemodynamic time courses (across the aMTG‐STG and pSTS‐TPJ ROIs) of the response in the left (a) and right (b) hemisphere to the auditory vocal (solid line) and non‐vocal stimuli (dashed line) for each of the three participant groups; LR (green), HR‐noASD (yellow) and HR–ASD (purple). Auditory stimuli were presented between 0 and 8 s. Note: error bars represent standard error. The schematic of the head illustrates the aMTG‐STG and pSTS‐TPJ ROIs used to generate the time course data.
