
Figure 4.
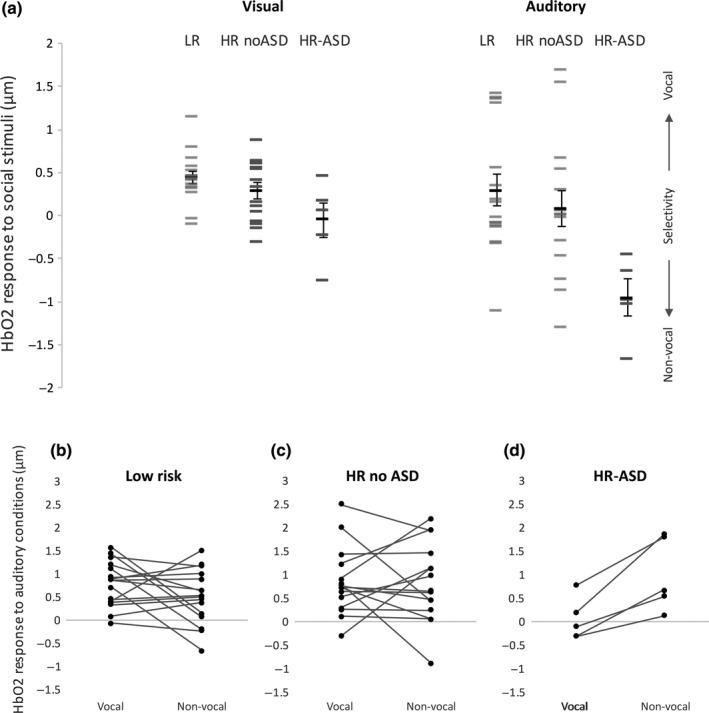
Upper panel (a) – Individual infants’ HbO2 responses to the visual (left) and auditory (right) contrasts. Individual visual responses (social relative to non‐social baseline) are averaged across ROI and hemisphere, while auditory responses (vocal minus non‐vocal response) are shown for the left hemisphere only (where the group differences were found). Lower panel – Paired observations of the vocal and non‐vocal responses for the LR (b), HR‐ noASD (c) and HR‐ASD (d) groups.