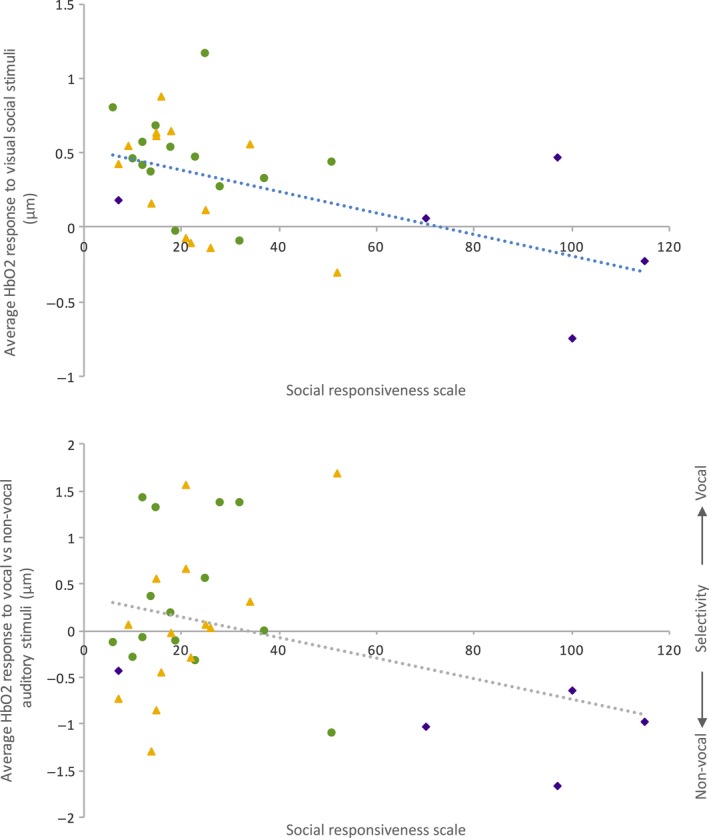
Figure 5.

Individual infant's social – non‐social HbO2 hemodynamic responses to the visual social stimuli averaged across ROI and hemisphere (left panel) and auditory vocal stimuli for the left hemisphere averaged across ROI (right panel) compared with their Social Responsiveness Scale (SRS) score. LR infants – green circle; HR‐noASD infants – yellow triangle; HR‐ASD infants – purple diamond.
