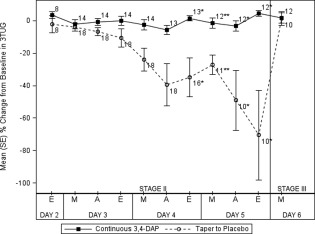
Figure 3.

Percentage change from baseline in 3TUG test at 2 h after dosing versus time, by treatment group. 3TUG, triple timed up‐and‐go. *P < 0.05, **P < 0.01, one‐way ANCOVA, with the baseline 3TUG as the covariate. 3,4‐DAP, 3,4‐diaminopyridine base; A, afternoon; ANCOVA, analysis of covariance; 3TUG, triple timed up ‐and ‐go; E, evening; M, morning.
