
Figure 3.
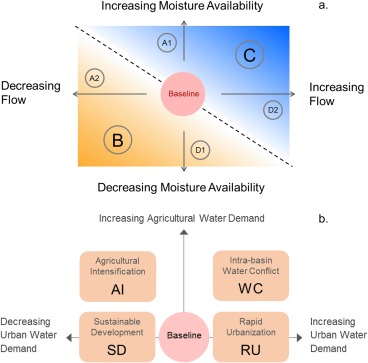
(a) Climate and (b) socioeconomic narratives for the CRBK for the 2050s. Climate narratives are displayed as a function of two key drivers (during the peak summer monsoon season): moisture availability in the Arabian Sea and strength of flow (West to East). The red circle in the center indicates the present day baseline conditions. Dashes divide the narratives into two triangles based on expected precipitation change. Upper (blue) triangle (covering narrative C) indicates increasing precipitation. Lower (brown) triangle (covering narrative B) indicates decreasing precipitation. Narratives A and D have precipitation similar to baseline conditions. Within A and D, A1 and D2 have a small increase in precipitation, while A2 and D1 have a small decrease in precipitation. Socioeconomic narratives that drive water demand are formulated as a function of agricultural and urban water demand and named according to their principal characteristic. Baseline conditions indicate present day demand.