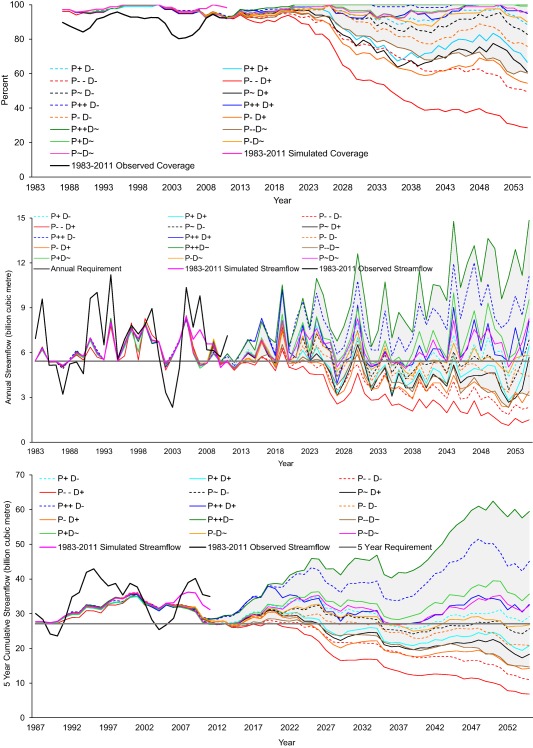
Figure 8.

15 Business‐As‐Usual (BAU) scenarios and simulations against the basin‐wide metric. (top) The 5 year moving average of instream flow requirement (IFR) monthly coverage. Coverage is the percent of months in which the IFR for downstream Tamil Nadu is met, calculated over a 5 year sliding window period. Monthly coverage = min(100%, 100 × simulated instream flow/IFR). BAU simulations use observed precipitation from 1983 to 2005 followed by the scaled baseline precipitation (adjusted according to the climate narratives) from 2006 to 2055. (middle and bottom) Annual and 5 yearly streamflow simulations, respectively, for BAU scenarios at Billgundala gauging station. In each plot, bold black lines indicate observations (1983–2011), bold pink lines indicate simulations for observed period (1983–2011) and grey shaded region indicates the range for BAU scenarios with baseline water demand (see section 3.2.1). The pink line uses observations up to 2011 and thus deviates from the simulations for the period 2006–2011. The horizontal black lines in middle and lower plots represent the integrated IFR requirement on annual and 5 yearly timescales.
